

Pyranometer measurements are typically expected to be free from shading so they can serve as a reliable reference in solar analysis. Any shading caused by surrounding objects, vegetation, or the horizon leads to an underestimation of solar irradiance. While pyranometer shading may sometimes occur simultaneously with shading on PV modules, in most cases, shaded data is excluded from further analysis.
However, excluding data reduces the amount of usable information and increases the uncertainty of subsequent analyses. It is therefore important to quantify the impact of shading on pyranometer measurements.
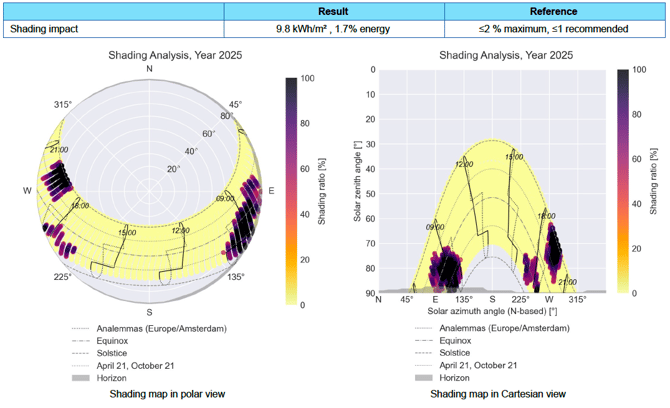
The Shading Impact test detects shading effects and evaluates their influence on the total energy estimate over the analysis period. The plot visualizes the directions used in the analysis and highlights shading patterns observed in the data.
How the Test Works
The test combines measured data with modelled clear-sky irradiance, reference data (such as satellite-based measurements), and solar position geometry to identify clear-sky conditions and detect consistent underestimation of irradiance at specific solar angles.
The results are expressed using a shading ratio as a numerical indicator, where 0% represents unobstructed sunlight and 100% indicates that the direct irradiance is fully shaded.
The same data is displayed on a polar plot representing the upper hemisphere and in Cartesian view.
How to Read the Polar Shading Plot
The polar plot shows the relative amount of shading using polar coordinates based on the sun’s position. The radial axis represents the solar zenith angle, with 0° at the zenith and 90° at the horizon. The angular axis represents the solar azimuth, with 0° pointing north and increasing clockwise toward the East. For reference, solar elevation values (the inverse of the zenith angle) are also shown.
Shading is indicated by color intensity, with darker points representing stronger shading. The grey area near the horizon shows the expected horizon shading based on terrain data for the location.
Each day appears as an arc from east to west. Summer days are shown as higher arcs, closer to the zenith, while winter days appear as lower arcs, closer to the horizon. To help relate shading patterns to time and date, selected days are marked with dashed lines, and analemma lines for specific hours are shown with solid lines.
The Cartesian view follows the same logic but uses solar angles as Cartesian coordinates. Beware, the Cartesian view may introduce significant non-uniform distortions, especially for solar positions close to zenith.
Example Plots
The plot below shows several months of data for a location at 52°N latitude. It indicates significant shading from both the east and west directions relative to the sensor. The impact on total energy over the analysis period is estimated at approximately 2%, as reported in the results table.
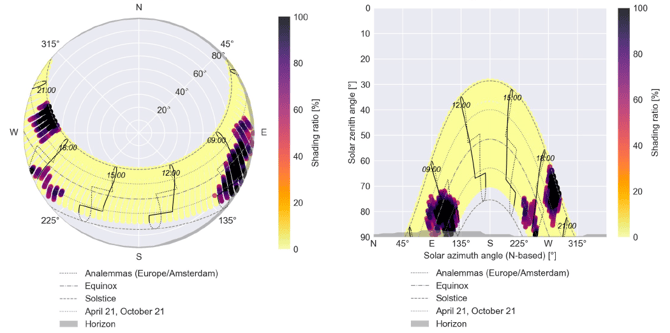
The plot below shows a full year of plane-of-array irradiance for a sensor tilted toward the east. Shading is observed from the west before the sun moves below the sensor’s tilted horizon. Moderate shading is also detected from a specific direction in the east during the winter months.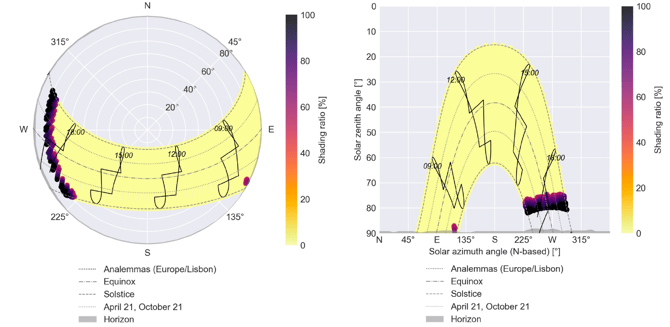
The plot below shows data collected in a mountainous area, with significant shading from the horizon consistent with the terrain profile of the location. Additional shading is also detected in the Eastern direction.
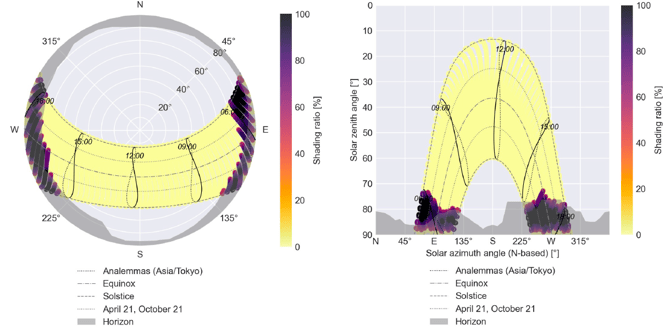
The plot below shows data from a tropical location in the southern hemisphere. Significant shading is detected from both the east and west. Some data gaps are also visible during parts of the year, particularly around spring and autumn.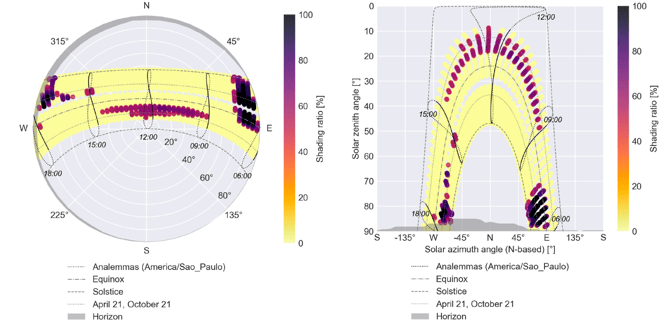
Final Note
The Shading Impact test helps identify and quantify shading effects, but its results should always be interpreted together with site knowledge and other diagnostic tests. Understanding the source and impact of shading is essential for improving data quality and reducing uncertainty in solar analysis.
The shading test depends on correct timestamp information. If the shading results are unclear, first check the Time Shift Test.
The shading test also depends on the correct sensor tilt and azimuth. To verify this, see Sensor Orientation Test.