

Pyranometers must be installed with high precision to ensure accurate irradiance measurements. According to the IEC 61724-1 standard, a maximum deviation of ±0.5° is allowed for sensors in a Class A monitoring system, and the instrument’s bubble level should be checked regularly. Modern pyranometers, such as the EKO MS-80SH, provide bubble level accuracy of up to ±0.1°, allowing for very precise installation. For horizontal measurements, EKO recommends carefully leveling the instrument using its built-in bubble level.
In practice, however, installation errors are common. Deviations of 1° or more occur frequently in the field, and even larger errors of 5° or more are not unusual. Using irradiance data with incorrect assumptions about sensor orientation can lead to significant bias and incorrect conclusions. The Orientation Test is designed to detect such inconsistencies and support further investigation.
Common Sources of Incorrect Orientation
1. Mistakes in documentation
Installation angles are usually recorded, but errors can occur during data entry or transfer. For example, tilt values may be swapped, or a tilted sensor may be incorrectly recorded as horizontal. Another common issue is confusion in azimuth conventions, particularly when 0° is referenced to South instead of North. These types of errors often produce clear and detectable patterns in the test results.
2. Inaccurate installation
Although installing a pyranometer may seem straightforward, errors can occur if procedures are not followed carefully. Tightening bolts after leveling or attaching additional equipment can introduce unintended tilt. Tilted sensors must be aligned using an inclinometer and compass, and incorrect use of these tools can result in misalignment that is not visually obvious. The Orientation Test is often able to detect and visualize these issues.
3. Orientation changes during operation
While initially installed correctly, sensors often receive extra tilt during operation. Metal mounting structures are often responsive to temperature and bend back and forth during the day. Heavy equipment, wind, and other mechanical impacts can temporarily or permanently bend the structure. Vibration and misalignment in moving parts of tracking devices contribute to the errors, too.
Such problems are often combined with poor system maintenance which leads to multiple problems and a complex picture. Once the data is collected, such errors are extremely hard to detect reliably and correct. It is always worth checking the instruments and the data early, at first signs of a problem or a doubt.
The Orientation Test helps detect and identify the problem early.
Impact of Orientation Errors
Large orientation errors of 5° or more are usually easy to detect, but they are not easy to correct once the data has been collected. In many cases, data affected by such errors should be rejected. An exception occurs when the issue is due to incorrect documentation, as this can sometimes be corrected and prevent further impact on the analysis.
The impact of smaller orientation errors depends on factors such as location, time of year, time of day, and weather conditions. As a rule of thumb, a 1° deviation in a horizontal sensor can introduce a systematic bias of around 1% in daily energy, although this may vary significantly from day to day.
This error also changes throughout the day, with the largest differences (often exceeding 10%) occurring when the sun is at lower elevations. The most critical bias, however, accumulates during periods of high irradiance, when most of the energy is collected but the error is less noticeable among other measurement uncertainties.
The image below illustrates the difference between a correctly leveled horizontal pyranometer and one tilted by 0.5° to the north, based on data collected in a tropical location. The polar plot on the left shows the relative error as a function of solar angles, while the plot on the right shows the resulting bias in daily energy. Even this small tilt leads to consistently incorrect irradiance measurements, resulting in up to 1% systematic bias in daily energy. The effect is more pronounced in winter, while in summer it may be partially masked by overestimation during morning and evening hours.

Smaller orientation errors of around ±2° are often misinterpreted as other issues, such as calibration uncertainty, soiling, or even time shifts in the data. This makes them particularly difficult to identify without dedicated testing.
How the Orientation Test Works
The test uses the full dataset together with modelled irradiance data to determine which sensor orientation best matches the measurements. For each assumed orientation, the difference between the measured and modelled data is calculated. This difference is expressed as the root mean square error (RMSE), which is visualized in the plots and used to estimate the most likely sensor orientation.
The test is performed both on the full dataset and on a subset filtered for clear-sky conditions. The clear-sky analysis relies on a smaller portion of the data, which can be limited in locations where clear-sky periods are rare or strongly seasonal. This may reduce the robustness of the results.
The analysis under all sky conditions includes a larger dataset and a wider range of solar angles. However, the results may be influenced by cloud effects or other issues in the data.
While one approach may provide clearer results in certain situations, EKO recommends considering both analyses together to obtain a more reliable interpretation.
How to Read the Orientation Test Plot

The table provides a summary of the subtest results. If any of the suggested orientations falls outside the expected range, the sensor orientation should be investigated further. In such cases, review the plots for additional insight and contact EKO or your trusted advisor if further support is needed.
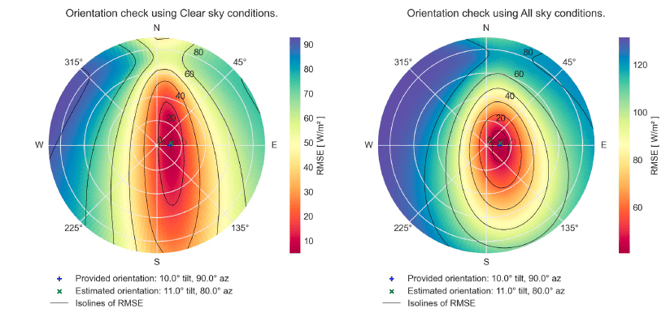
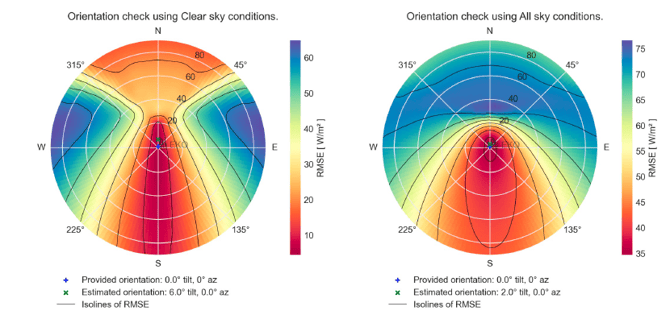
Each orientation is represented by a color indicating the root mean square difference (RMSE) between the measured data and the model data for that orientation. The expected orientation and the best-matching orientation are shown as blue and red circles, respectively. Lines of equal error (isolines) are included to improve readability.
The first isoline around the best-matching orientation provides an estimate of the test accuracy. As a rule of thumb, if the expected orientation lies outside this isoline, the data can be considered to have failed the test and should be investigated further. If both points are very close and fall within the same isoline, this strongly suggests that the sensor orientation is correct.
EKO recommends analyzing the results using different reference datasets, time periods, and parameter settings to gain a better understanding of the data and to help identify any underlying issues.
Common Patterns
Use the typical patterns as a starting point of your investigation.
1. The clear-sky version appears elongated in the north–south direction, while the all-conditions version is more compact.
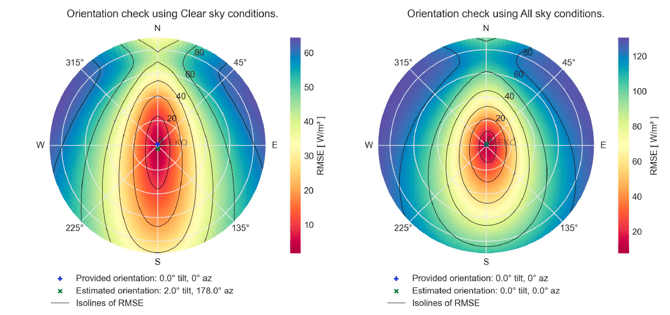
This pattern is typical for sufficiently long datasets in cloudy locations. Clear-sky periods are limited and are often concentrated in specific seasons, typically summer. This means they represent only a subset of solar angles. As a result, even relatively large assumed tilts toward the north or south can be partially compensated by small bias adjustments, which reduces the resolution in that direction. Including data from all sky conditions introduces a wider range of solar angles and helps better constrain the estimated orientation.
2. Both versions show similarly elongated patterns and relatively low precision
This typically indicates that the dataset is of good quality but too short to provide a reliable result. Extending the analysis period can help improve confidence. Some mismatch between the reference data and the measurements is also expected and does not necessarily indicate a problem. To gain further insight, it can be helpful to compare results using different reference datasets, such as a co-located reference sensor.
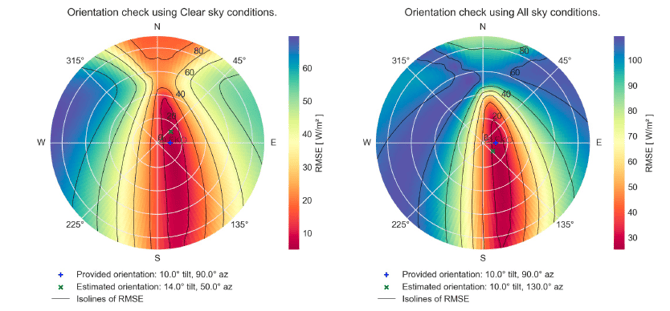
3. The two plots suggest significantly different best-matching orientations
This pattern indicates that further investigation is required, as the issue is likely not related solely to sensor orientation. Possible causes include sensor shading, incorrect location data, or a time shift in the measurements. Changes in sensor orientation during the analysis period may also contribute to this behavior.
4. The plots do not look like normal orientation plot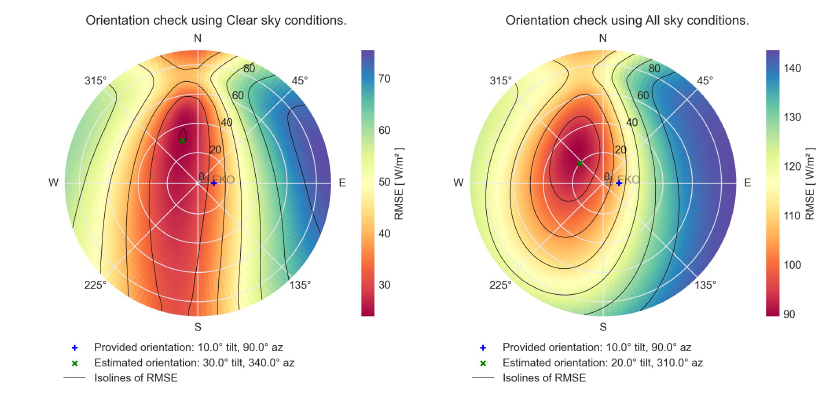
This usually means the problem is not related to sensor orientation, and the Orientation Test may not give reliable results in this case. Check the Data Overview section and basic settings such as sensor location and timezone. It is also helpful to look at other tests, such as Time Shift and Shading Impact, to better understand the issue.
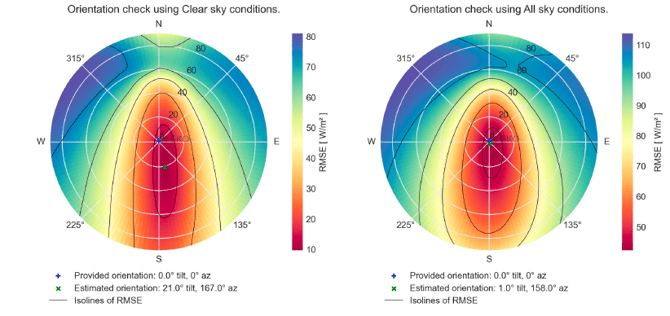
5. The plot wrongly suggests a decent match at the edge of the plot
The apparent good match that you see is a limitation of the method when too few data is used for the plot. n this case, the assumed tilt may be artificially compensated by an assumed bias, leading to a misleading result.
Final Note
The Orientation Test is a diagnostic tool that helps identify potential issues in sensor alignment. Its results should always be interpreted together with other tests and site-specific knowledge. If any inconsistencies are observed, further investigation is recommended.
The orientation test can be affected by timestamp errors. If a time shift is suspected, first review the Time Shift Test.