

The deviation between the measurement data and reliable reference data, analysed as a function of solar zenith angle, provides a unique perspective on data consistency. The plots in this section are particularly useful for detecting subtle effects in the data after overall agreement has been verified.
Depending on the dataset used, this comparison can help identify:
- limitations of irradiance models at low solar elevation angles,
- small time shifts,
- sensor orientation mismatches,
- pyranometer cosine response effects,
- and other potential issues.
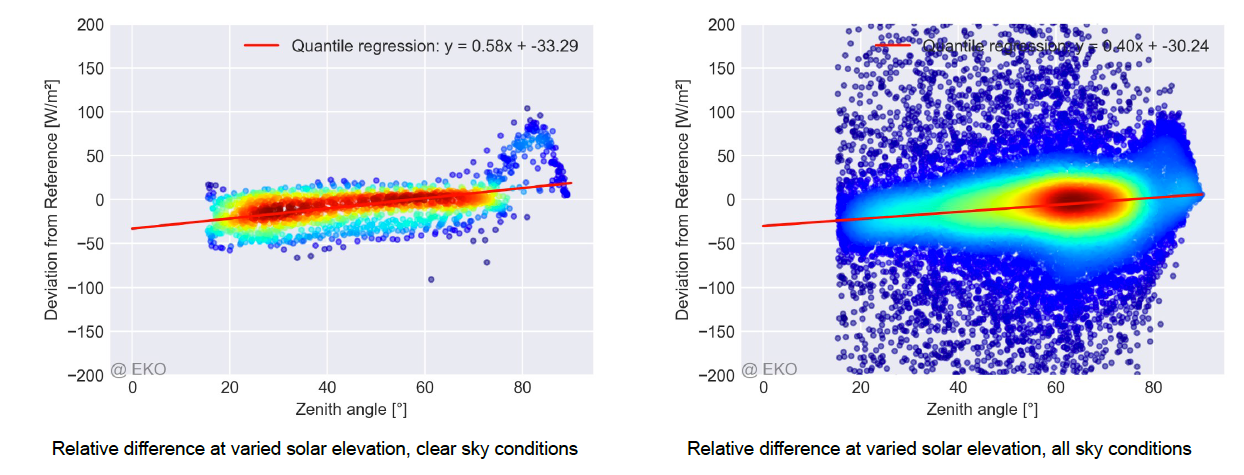
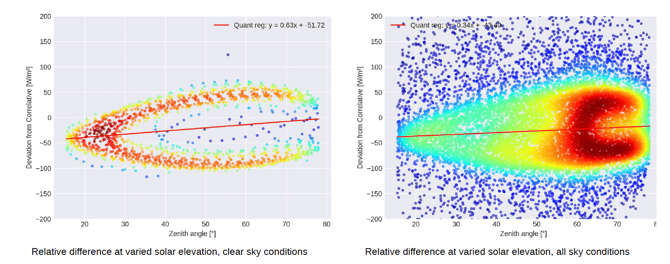
The plots show the absolute irradiance difference between the two datasets on the Y-axis, plotted against the solar zenith angle corresponding to each data timestamp on the X-axis. Separate plots are provided for:
- data filtered for clear-sky conditions, and
-
data representing all-sky conditions.
Please note that these plots do not directly characterise directional response or other specific sensor properties. They should be used as a starting point for further investigation.
Typical patterns
1. Mostly straight horizontal line around the zero baseline
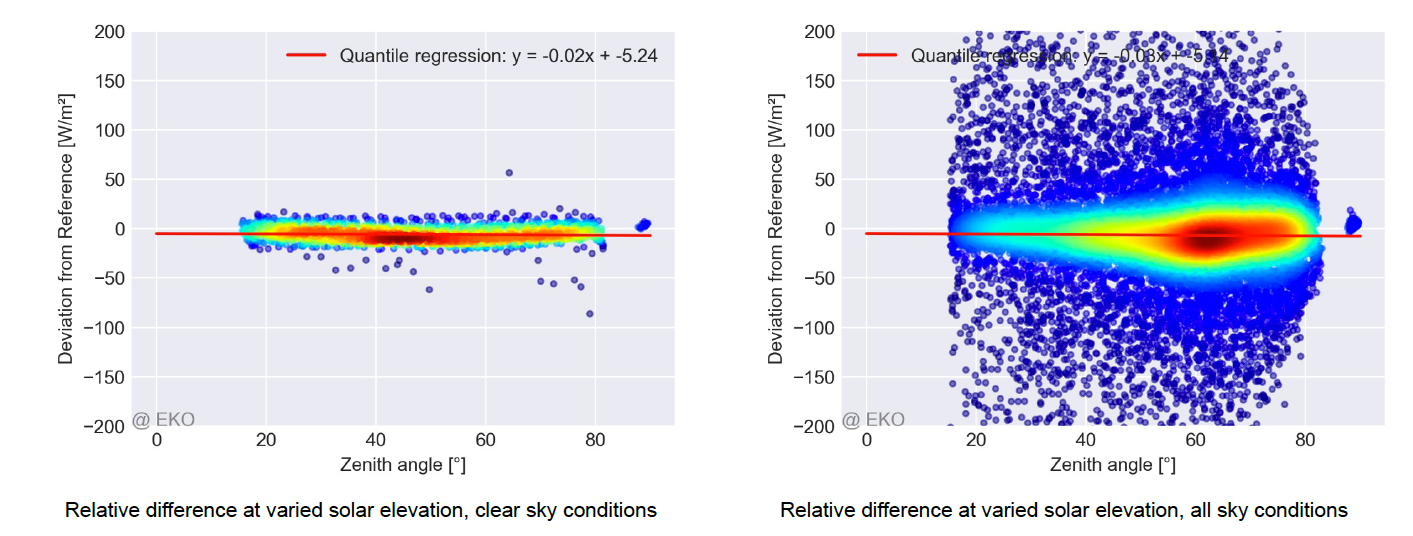
This is the expected pattern for healthy data. Small variations around the baseline in the clear-sky plot, together with scatter up to approximately 200 W/m² in the all-sky plot, generally reflect the expected limitations of the reference irradiance model.
2. Thin inclined line
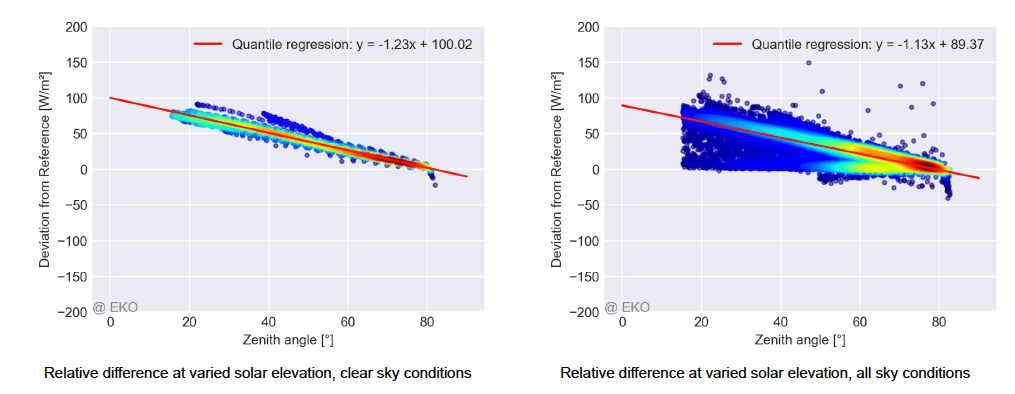
When comparing a well-maintained sensor to a reference instrument, this pattern may indicate a mismatch in instrument calibration and/or directional response. Further investigation is required before drawing conclusions.
Review the insights provided in other sections, particularly General Linearity, and consult a trusted expert if necessary.
3. Split pattern at higher zenith angles
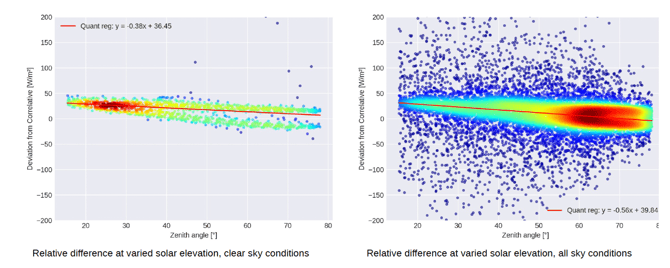
A small but systematic overestimation or underestimation at low solar elevations is typically associated with a slight time shift or a similar issue.
The shift may be small enough for the Time Shift test to pass, while still appearing as a result of:
- timestamp inaccuracies,
- data processing errors,
- or inconsistencies in the reference data.
Further investigation is recommended to determine whether corrective action is necessary.
4. Circular patterns or highly scattered data
This pattern is typically caused by significant mismatches related to time zone configuration, site location, sensor orientation, or other fundamental setup parameters.
These issues are usually also visible in other analyses, such as Time Shift and Sensor Orientation. Major configuration issues should be resolved before relying on the solar zenith angle analysis.
Final note
This analysis should be used as a pattern-recognition tool, not as a standalone diagnosis. Any deviations should be reviewed together with other report sections, especially General Linearity, Time Shift, and Sensor Orientation, before drawing conclusions or taking corrective action.
Angle-dependent deviations may sometimes be influenced by shading or site obstructions. For related checks, see Nearby Shading.