

Carpet plots are commonly used to visualise solar irradiance over long periods of time. In EKO Q, they are used to quickly inspect your data immediately after upload and in various sections of the Data Quality Report.
Once you know how to use them, carpet plots are a powerful visualisation and diagnostic tool.
.png)
How a Carpet Plot Is Made
A carpet plot is created by reshaping a time series into a two-dimensional matrix, where rows represent time of the day and columns represent days of the year. Each cell is colour-coded according to the variable’s magnitude.
You can think of it as irradiance data split into individual days and stacked side-by-side, as illustrated in the video and step by step explanations below.
Step by step
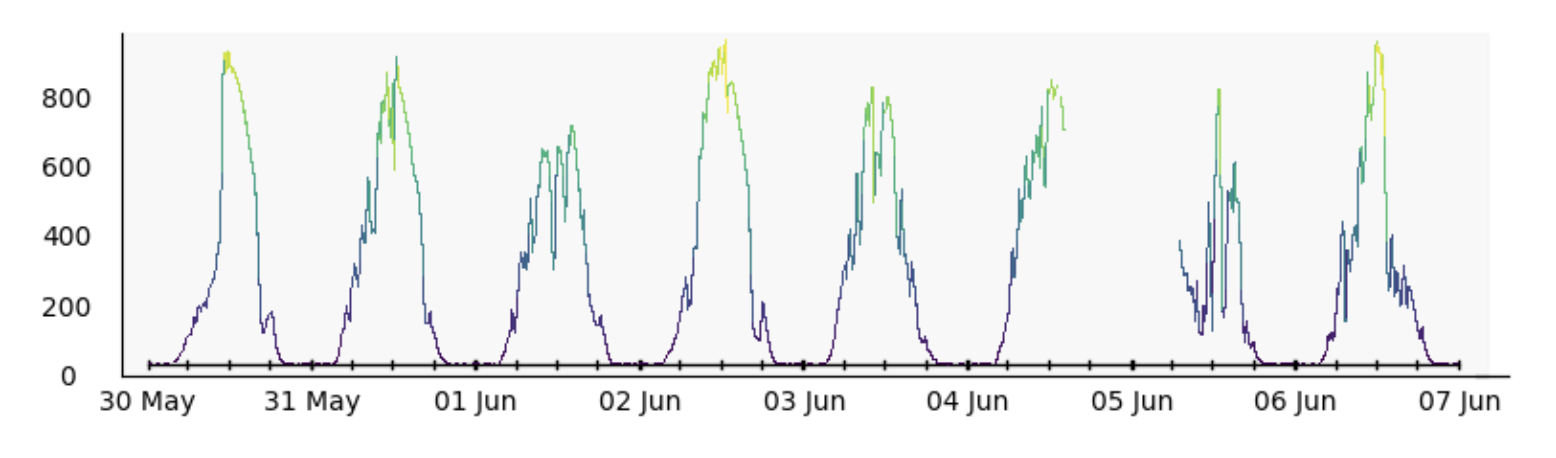
1. Plot irradiance versus time, using colour to represent the irradiance level.
 2. Split the data into daily segments and rotate them in 3D as thin ribbons.
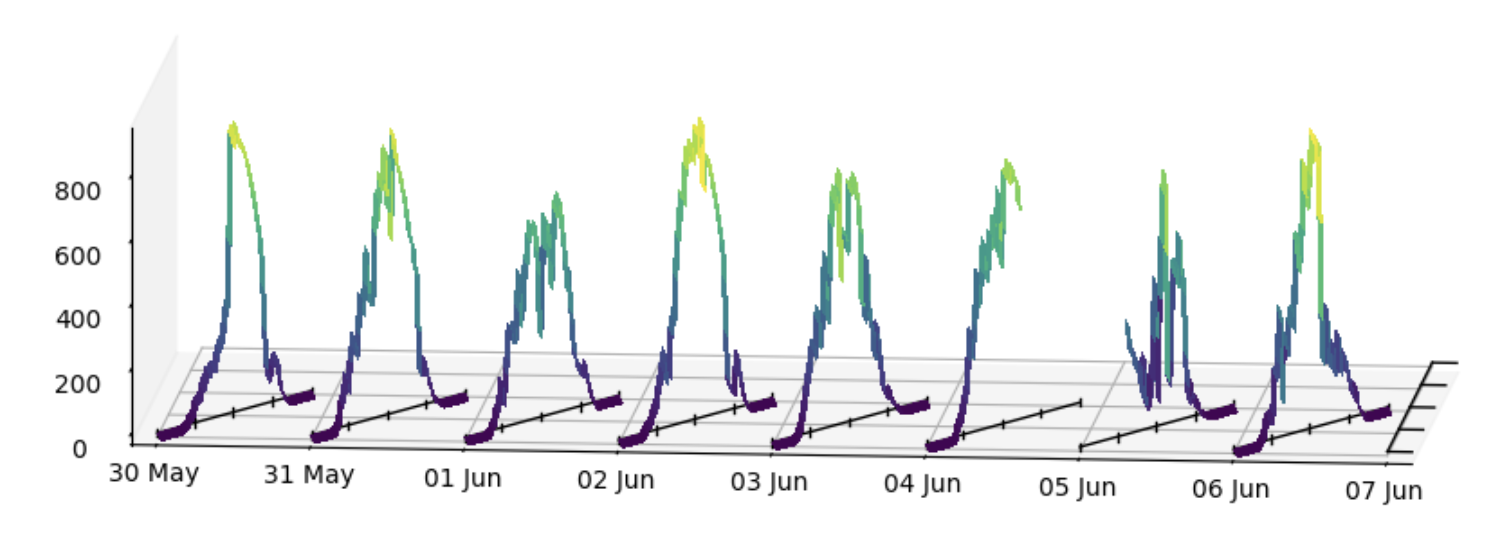
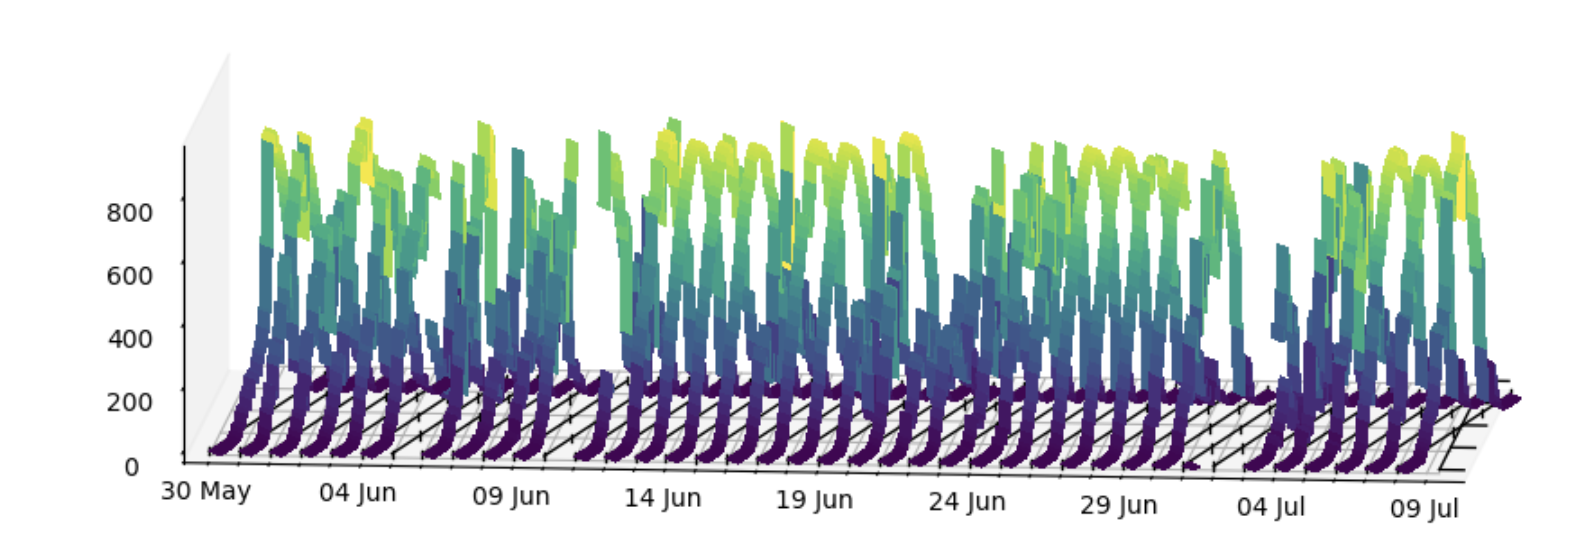
3. Stack the daily ribbons tightly together and view them from above.
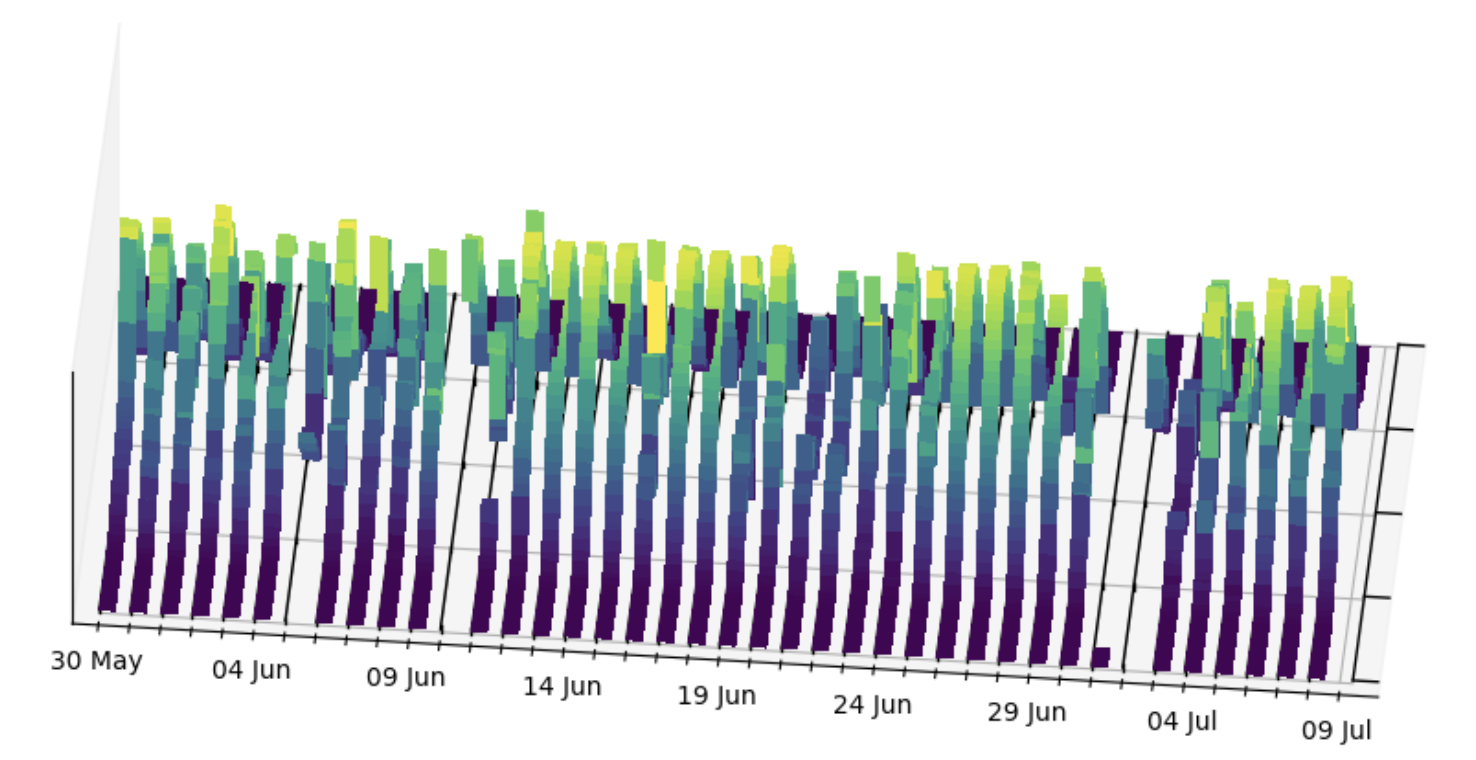
4. Remove any gaps between days for a continuous visual representation.
3. Stack the daily ribbons tightly together and view them from above.
4. Remove any gaps between days for a continuous visual representation.
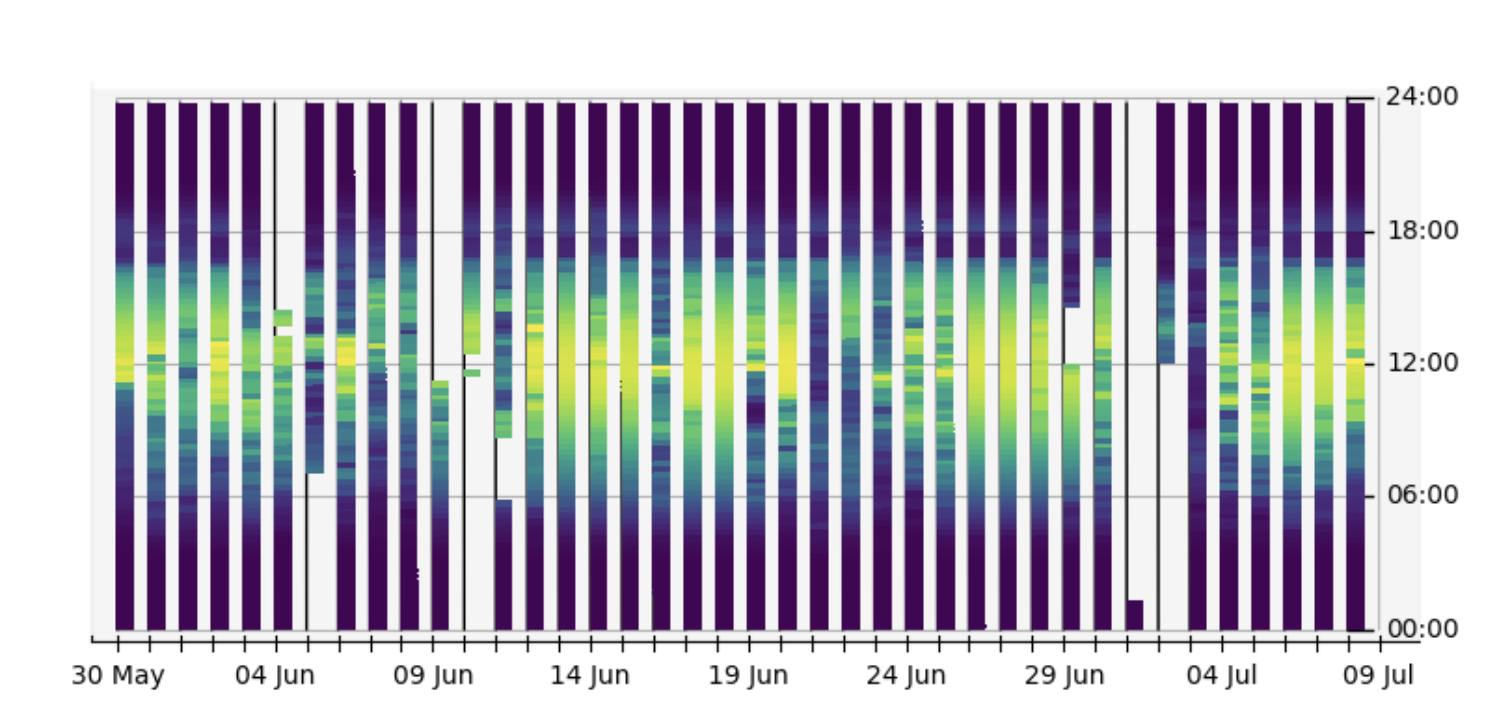
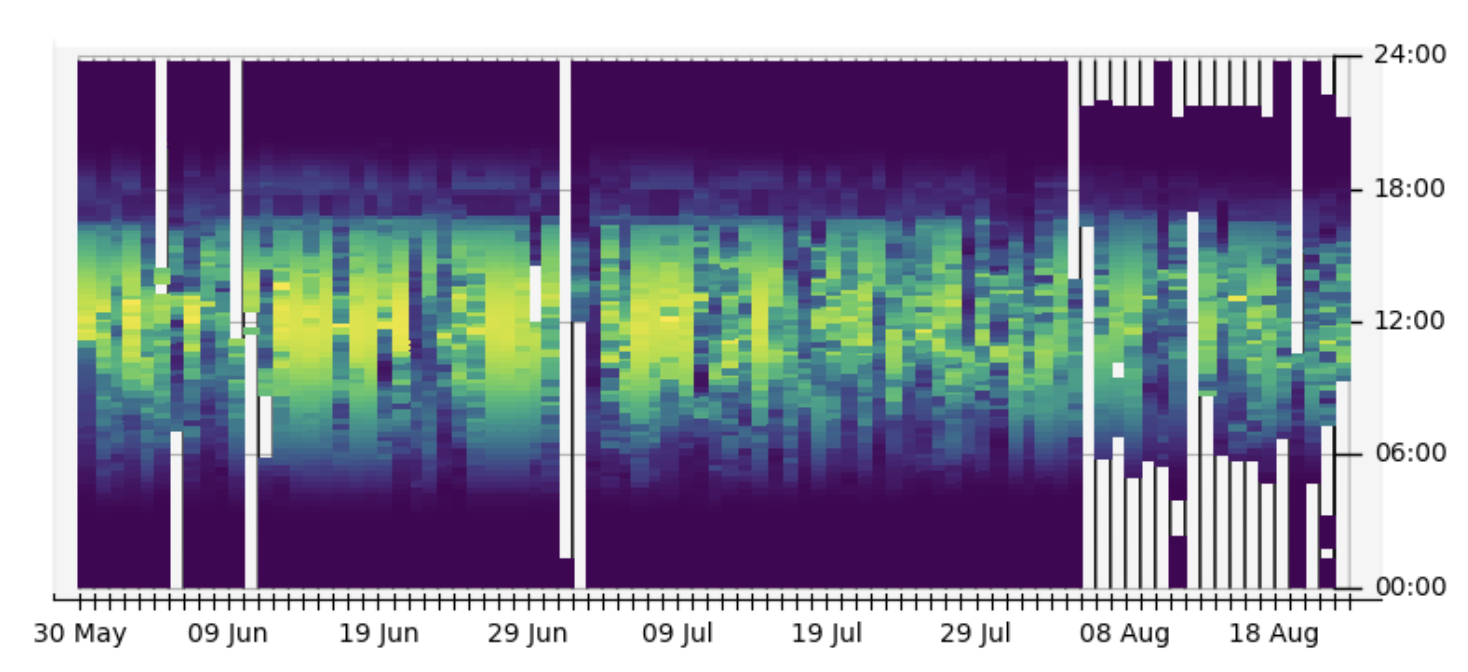
How to Read a Carpet Plot
Carpet plots display the entire dataset, including data gaps and diurnal patterns. They allow you to:
- Examine how irradiance behaves at specific times of day
- Observe how it changes throughout the year
- Detect missing data or anomalies
For additional tips on using carpet plots to diagnose your data, see How to Read a Carpet Plot