

Navigate to the Analyses tab and click on “Add Analysis” to start a new analysis.
EKO recommends visually reviewing your data using the visualization tools described in the Preview sensor data section. Once you are confident that the data has been imported correctly, proceed to the Configure Analysis tab.
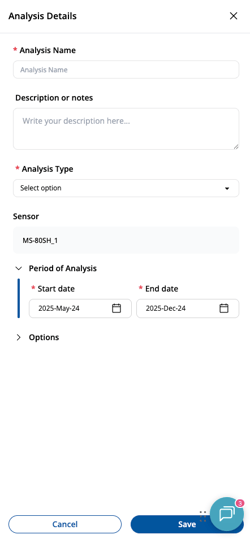
Provide short Analysis Name and description. EKO recommends using short unique analysis names to simplify management of multiple analyses later.
Fill all the required fields. EKO recommends skipping Options until you are familiar with EKO Q and all the detailed settings.
Correlative Data is key to this type of analysis. Choose it well. EKO recommends trying two or more sources of correlative data and compare results of analysis before drawing conclusions.
LUC data and CAMS data are recommended by default. If these options are disabled, configure the respective API tokens as described in Setup access to correlative data section. “Automatic” options allows EKO Q to choose one of the available sources based on sensor location and period of analysis.

Specify time period of analysis. Longer periods may take longer to analyze, while too short a period may miss on important trends. Typical recommended period duration is 6 to 12 months.
EKO Q Starter users can run this analysis but only have access to the Summary Analysis, which contains the first two pages of the full report.

Run the analysis clicking on Run (![]() ) button.
) button.

You can continue using EKO Q while the analysis runs.
Next article: Download and open an analysis report
Previous article: Configure analysis