

Once you have successfully imported irradiance measurement data, you can review it in the Data Overview tab. This section provides immediate insights through visualizations and key metrics. Issues such as data gaps, spikes, time shifts, incorrect units, or misalignments are often easy to identify at a glance.
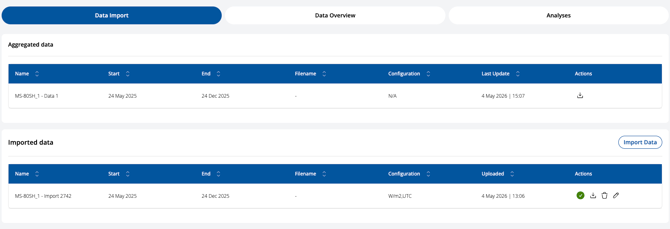
In the Data Import section, you can view the history of your uploads, along with a summary of how multiple imports have been merged. You can also assess, edit, or delete individual imports using the action buttons on the right (![]() ).
).
Back in the Data Overview, you can use the Carpet Plot to visualize the entire dataset in a single view. You can select the time period you want to analyze.

For more information on how to interpret a carpet plot, please refer to: What is Carpet Plot?.
You can also use the Time Series Plot to visualize irradiance data over time and compare multiple datasets.

Finally, use automated Configuration Check along with visual inspection to validate your data quality.
Now that you have checked your data and everything looks correct, you can proceed with running the analysis: Choose and Configure an Analysis.